Kodaikanal: Astronomers have achieved a breakthrough in tracking how the Sun’s magnetic activity varies with latitude, offering fresh insight into solar cycles and their impact on Earth. The findings could strengthen scientific understanding of the Sun’s magnetic dynamo and improve future predictions of space weather events that influence communications systems, power infrastructure, and even climate patterns.
The Sun experiences an 11-year activity cycle, marked by shifting magnetic behavior and changing sunspot patterns. To study these variations, researchers from the Indian Institute of Astrophysics (IIA), an autonomous institute under the Department of Science and Technology (DST), analyzed 11 years of continuous calcium K line spectroscopic data (2015–2025) recorded at the historic Kodaikanal Solar Observatory, which recently completed 125 years of operation.
The Ca-K spectral line at 393.4 nm – originating from the Sun’s chromosphere – is widely recognized as a key diagnostic tool for monitoring magnetic activity. With the observatory’s extensive daily solar imaging archive, the team could examine long-term changes with a level of precision rarely achieved.
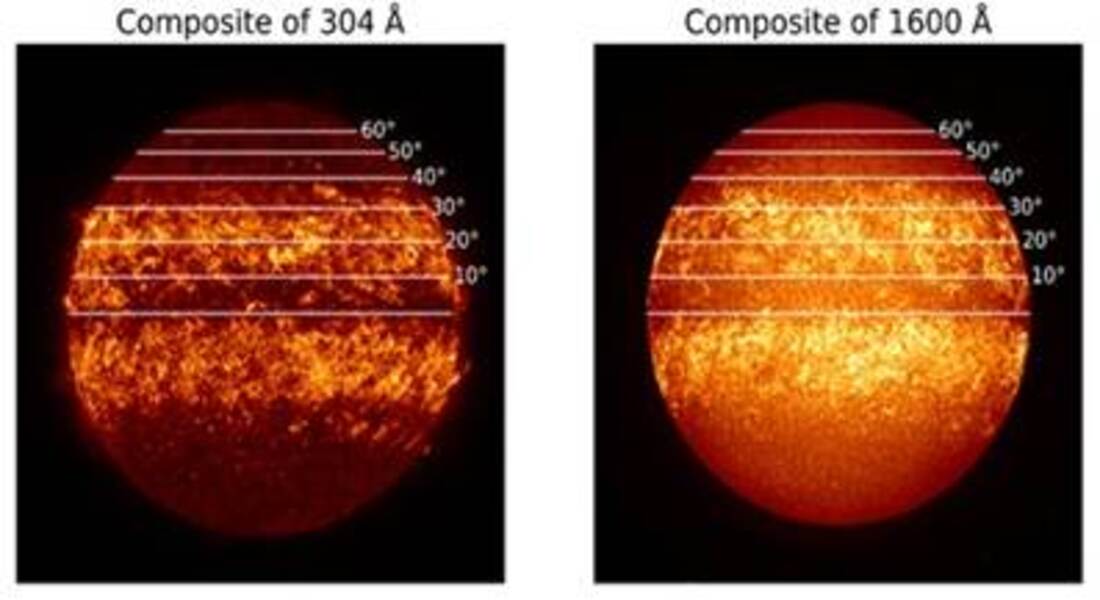
Instead of studying isolated sunspots, the researchers implemented a unique technique developed by IIA professor Jagdev Singh. As explained by K.P. Raju of IIA, “Rather than looking at individual sunspots or magnetic regions, we used an earlier technique devised by our team member and professor at IIA, Jagdev Singh, that captures light from entire latitude bands, slicing the Sun into horizontal strips from pole to pole and analyzing the combined light from each strip.” According to him, this approach helps reveal broader magnetic patterns invisible through traditional analysis.
The team tracked spectral features such as line width and intensity ratios – indicators linked to magnetic strength – throughout Solar Cycle 24 and continuing into Solar Cycle 25. Their analysis showed distinct clustering of activity, according to an official statement.
Co-author K. Nagarju noted: “The data revealed clear patterns showing that most solar activity concentrates between 40 degrees north and south latitudes, with particularly strong signals around 15–20 degrees in both hemispheres of the Sun, exactly where sunspot activity peaks during the solar cycle.” These results were strengthened through cross-verification using filling factor measurements from NASA’s Solar Dynamics Observatory.
The study also uncovered clear differences between the Sun’s northern and southern hemispheres, with the south exhibiting steeper increases in magnetic signatures and greater sensitivity to activity levels. Researchers developed “spectral response profiles” to quantify how changes in magnetic filling factor altered the Ca-K line – revealing systematic north-south asymmetry closely tied to latitude.
Lead author Apoorva Srinivasa said: “Our results confirm that solar activity follows predictable patterns related to the 11-year solar cycle, with the strongest magnetic activity occurring in specific latitude bands that shift over time. The observed variations directly reflect changes in temperature and magnetic field strength across the Sun’s chromosphere, contributing to our broader understanding of how the Sun’s magnetic dynamo operates.”
The findings, published in the Monthly Notices of the Royal Astronomical Society, were authored by researchers from IIA, Amrita Vishwa Vidyapeetham, IIT BHU, and NASA-linked analysis teams.