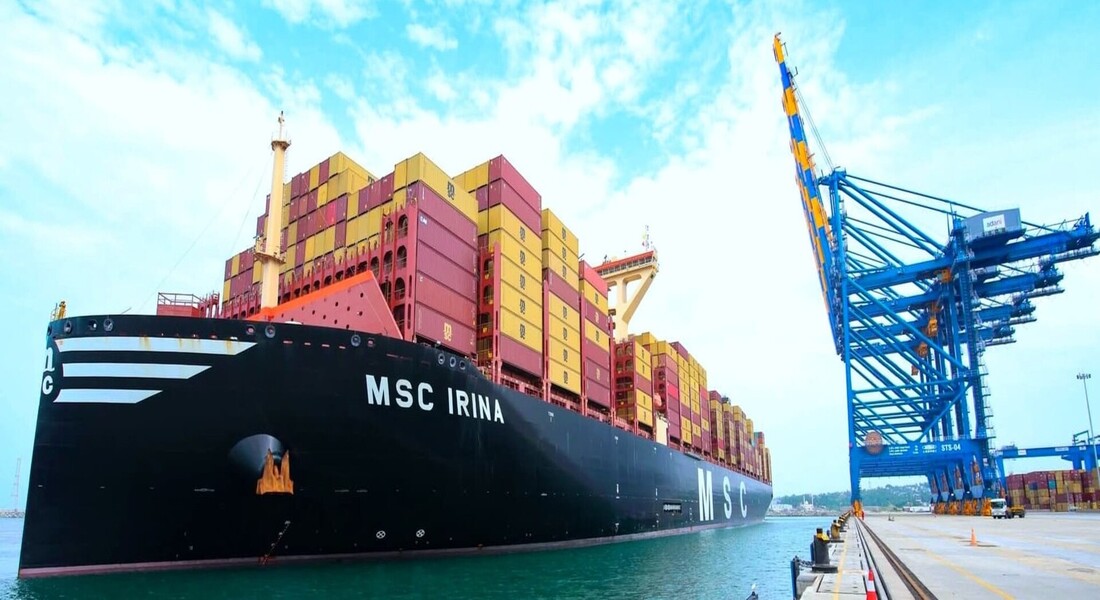

New Delhi: India’s total exports, combining merchandise and services, are estimated at USD 80.80 billion in April 2026, reflecting a strong 13.59% increase compared to April 2025. Total imports during the same period are estimated at USD 88.61 billion, marking a 7.67% rise year-on-year, indicating a widening but stable trade balance dynamic.
Merchandise exports for April 2026 stood at USD 43.56 billion compared to USD 38.28 billion in April 2025, registering a growth of 13.78%. Non-petroleum exports were valued at USD 33.97 billion, showing a 9% increase over the corresponding period last year.
The export growth was primarily driven by strong performance in key sectors including petroleum products, electronic goods, engineering goods, meat, dairy and poultry products, and drugs and pharmaceuticals. Petroleum product exports rose sharply by 34.66% to USD 9.59 billion, while electronic goods recorded a significant increase of 40.31% to USD 5.18 billion, according to an official statement.
Engineering goods exports increased by 8.76% to USD 10.35 billion, reflecting steady industrial demand. Meat, dairy, and poultry product exports surged by 48% to USD 0.55 billion, while drugs and pharmaceuticals exports rose by 7.12% to USD 2.66 billion.
Non-petroleum and non-gems and jewellery exports were valued at USD 31.64 billion, compared to USD 28.66 billion in April 2025. On the import side, non-petroleum and non-gems and jewellery imports stood at USD 45.87 billion, rising from USD 39.75 billion in the previous year.
Services exports for April 2026 are estimated at USD 37.24 billion compared to USD 32.85 billion in April 2025, reflecting a growth of 13.36%. Services imports during the same period are estimated at USD 16.66 billion, slightly lower than USD 16.91 billion in April 2025.
Several export categories recorded strong positive growth, including other cereals at 210.19%, meat, dairy, and poultry products at 48.03%, electronic goods at 40.31%, petroleum products at 34.66%, handicrafts excluding handmade carpets at 26.21%, marine products at 14.74%, and minerals and ores at 13.85%. Other sectors, such as engineering goods, coffee, chemicals, pharmaceuticals, textiles, and leather products also registered steady gains.
On the import side, declines were recorded in chemical materials and products, pulses, precious stones, newsprint, crude petroleum, wood products, textile yarn and fabrics, cotton raw materials, iron and steel, machine tools, and pulp and waste paper, indicating contraction in several commodity-linked segments.
Top export destinations showing strong growth included Singapore, Tanzania, Sri Lanka, Bangladesh, and Hong Kong. On the import side, major sources with growth included China, Russia, Oman, Peru, and Saudi Arabia, reflecting shifting global trade flows.